Facility balance
Our approach towards facility balance is that we design a model to simulate different load cases and plant configurations in order to process the plant balancing by means of process simulation. We compare the developed energy balances according to the specifications and technical evaluation criteria (e.g. from the EU taxonomy).
We create the necessary simulation models, for example, with the help of the process simulation software IPSEpro (SimTech). With IPSEpro, it is possible to efficiently calculate mass, energy and energy balances for process plants or plant components and to correlate different process parameters or to show the dependencies.
Substance data for water, ideal gases, organic substances, solids etc. as well as common components (pumps, compressors, heat exchangers, reactors, valves etc.) are available in a model library or are developed if necessary. These enable the simulation of complex processes in different degrees of detail through combination.
Our services
The input data is provided by the customer. Seasons are taken into account as required. This enables the simulation of summer and winter operating conditions with a supplementary profitability analysis.
The simulation model to be designed takes into account the existing relevant generation, conversion and consumption plants within the system boundaries under consideration. From the actual configuration or the desired configuration, we simulate the load cases to be considered.
Typical input data for power stations are:
- Fuel compositions and heat outputs
- Steam mass flows in the form of produced steam, (un)converted steam and steam required for consumers
- thermal and electrical outputs or own consumption
- (maximum) generator outputs
- Further facility data such as efficiency, pipe dimensions and limits regarding flow rates, outputs, etc.
- specific marginal costs for the calculation of specific operating costs
Usual results:
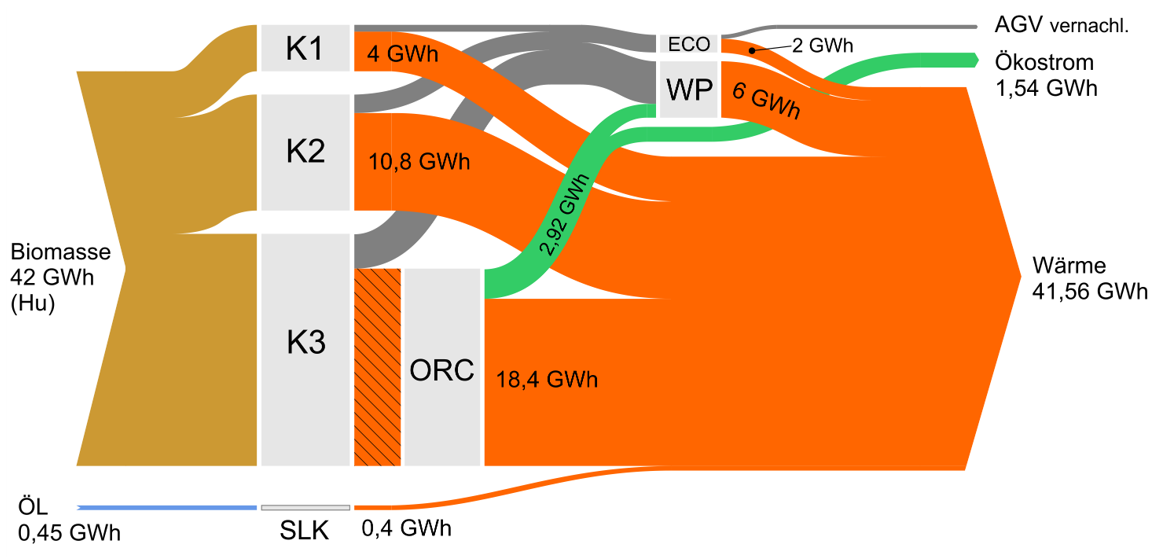
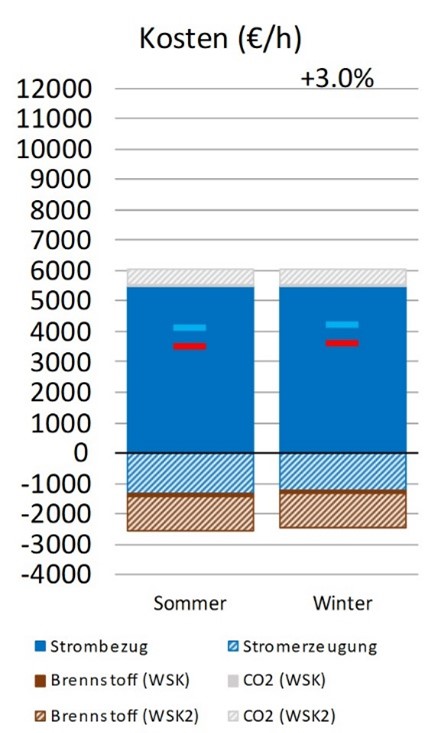
We present the results of the process simulation using selected load cases. These include cost diagrams (cost and revenue shares, cost difference summer to winter operation in percent), steam mass flow diagrams and an overall picture as Sankey diagrams, in which the thickness of the bars or flows reflects the outputs.
Related topics
Products
Blog article on the topic