Status analysis
In the status analysis, we focus on plant and operating conditions, energy efficiency, environmental impacts, emissions and all associated data that serve optimisation.
Energy efficiency analysis is a central approach to identifying weak points and unused potential in the plant or energy system (sources, sinks, storage and distribution networks). The isolated consideration of individual optimisation measures often leads to diminished success due to hidden interactions and consequences. We therefore focus on a holistic analysis of the diverse interactions in your system network or in the entire energy cycle.
You benefit from a transparent and readable representation of the existing often complex physical relationships. With this approach, we strengthen the understanding of your systems and their optimisation potential.
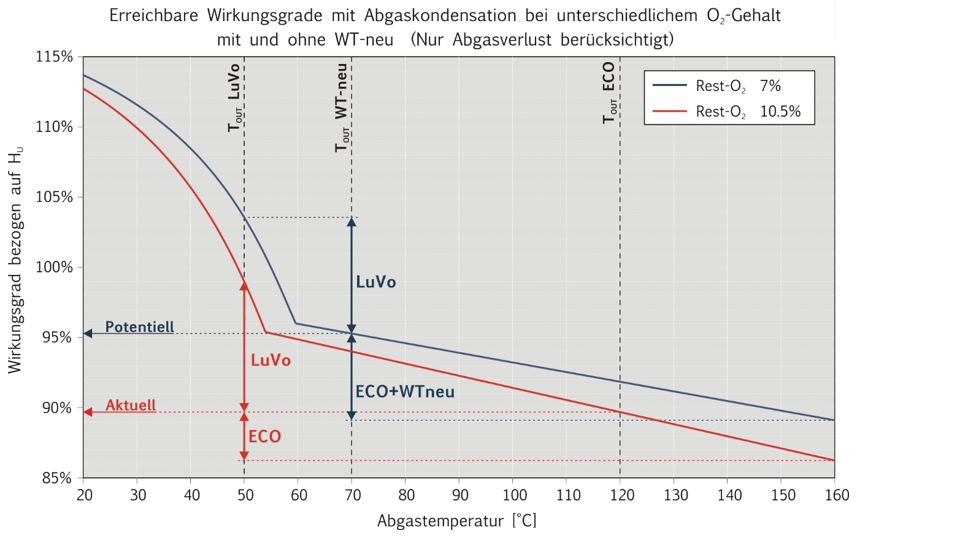
Example: Increasing efficiency through flue gas condensation / waste gas condensation
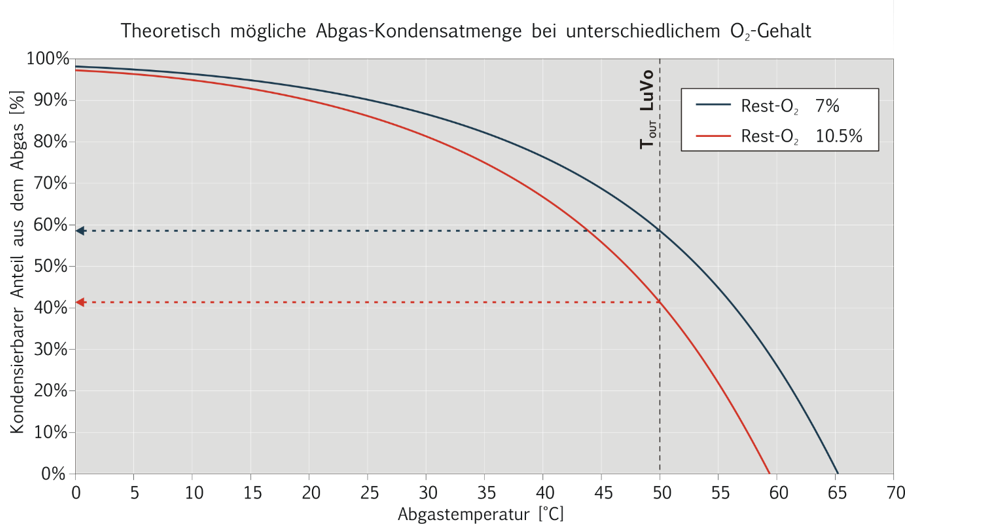
The recovery of energy from the flue gas of the thermal biomass plant is a technically mature method of increasing energy efficiency and consequently leads to direct fuel savings. The deeper the cooling of the flue gas, the more latent heat can be extracted from the flue gas (see following figure). The amounts of energy made available in this way depend on the fuel water content and the residual oxygen content in the flue gas as well as significantly on the possible temperature reduction of the flue gas.
Analysis data (operating data)
Classical process visualisation systems are usually limited to displaying measured and control variables or depicting them in time trends. However, the unprocessed display of a multitude of individual values often corresponds more to an information overload than to an information gain. Only very experienced observers can read off known and learned states – desired or undesired. Achieving the optimal operating state in complex systems is practically impossible with this information situation.
Compared to experience-based analysis, detailed process data analysis also reveals hidden and unexpected correlations in energy systems and is thus an essential tool for cause-effect analysis.
We continuously log process data with special data loggers or analyse exported historical data. With this data, the status of the plant can be analysed, problems in operation identified and audits carried out. Based on this information, optimisation measures are developed and benchmarking with other plants is carried out.
With a view to mostly existing digitalisation initiatives, a detailed process data analysis also lays the foundation for the integration of intelligent machine learning-based prognosis and diagnostic tools. The identified specific correlations, interactions and performance indicators in your plant configuration can be integrated and observed in your real-time visualisation in the form of soft sensors or calculation algorithms.
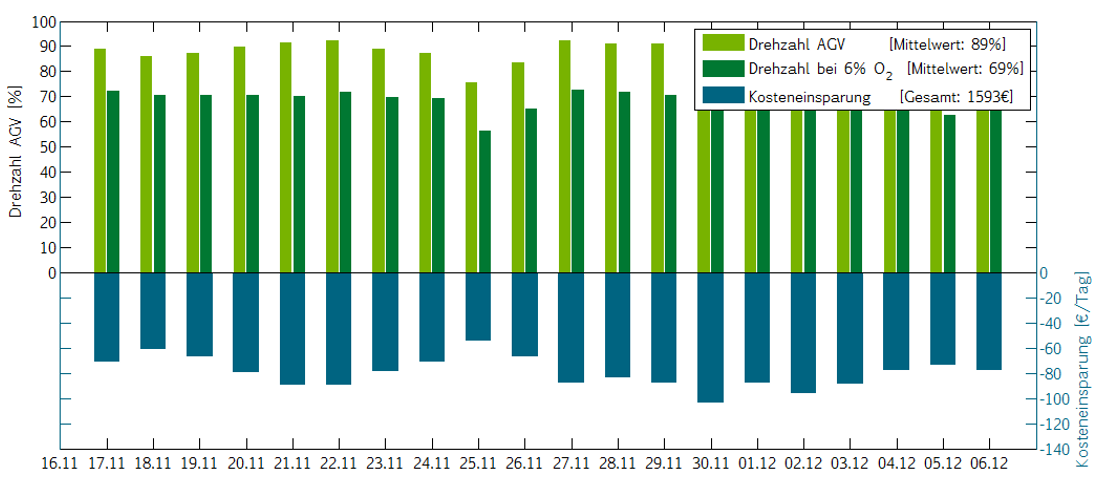
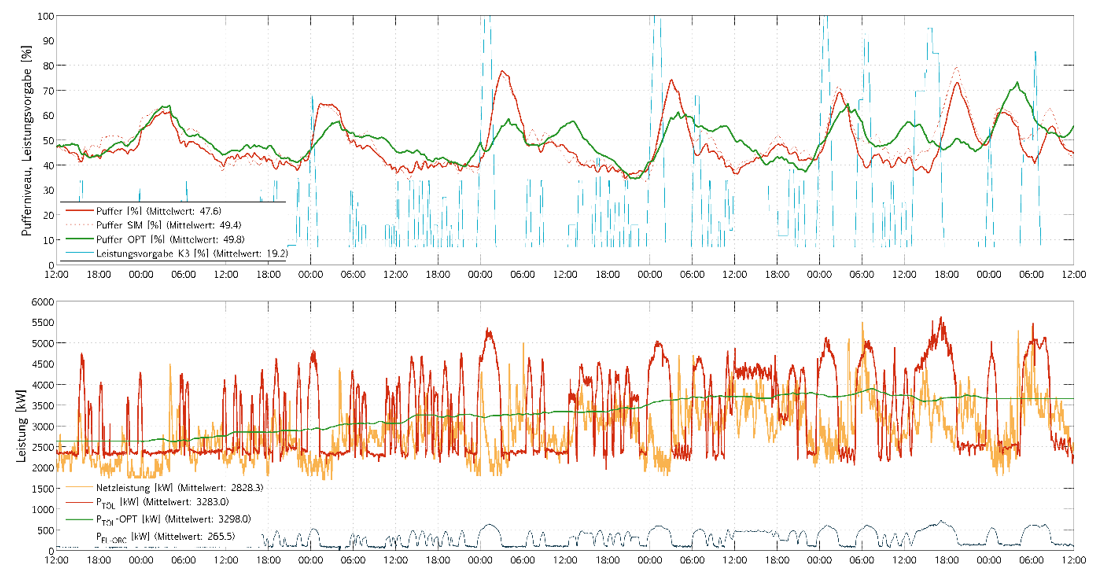
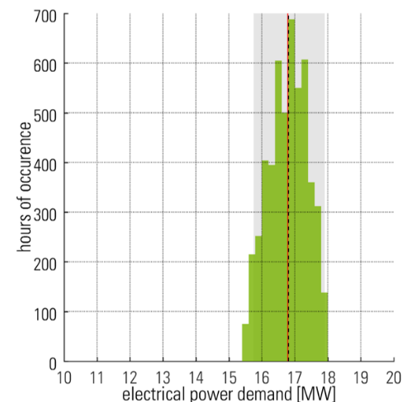
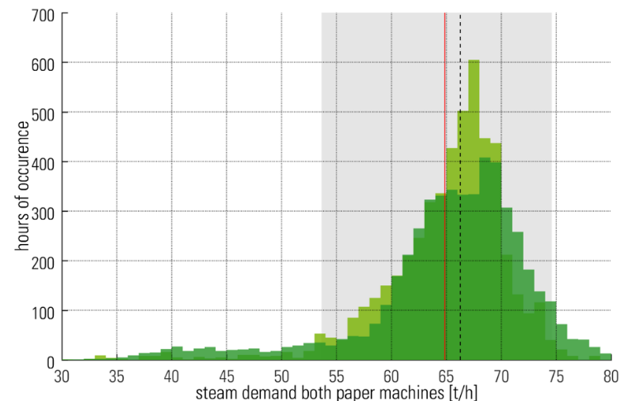
The following examples show a brief excerpt from specific projects.
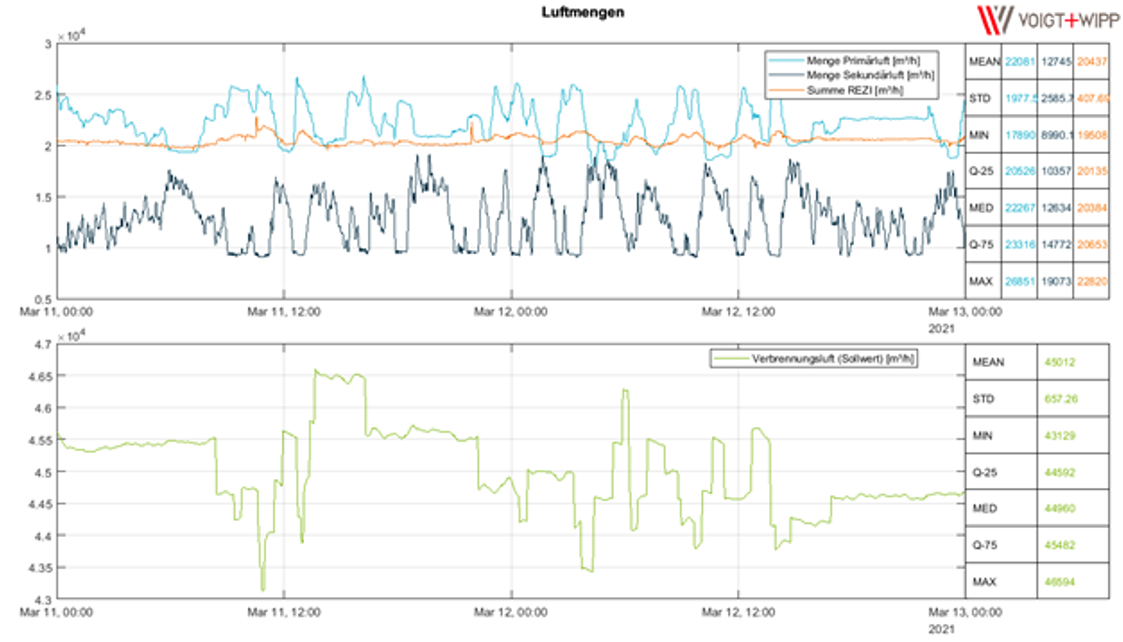
Examples from process data evaluation
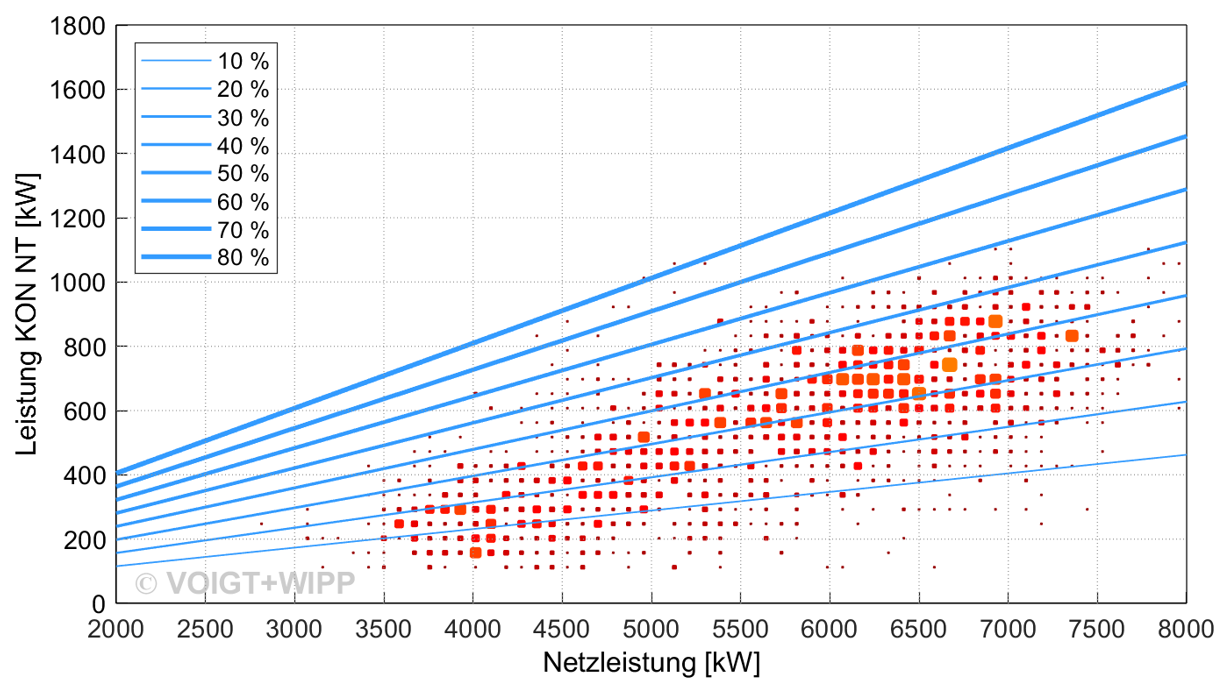
Examples of static process data evaluation
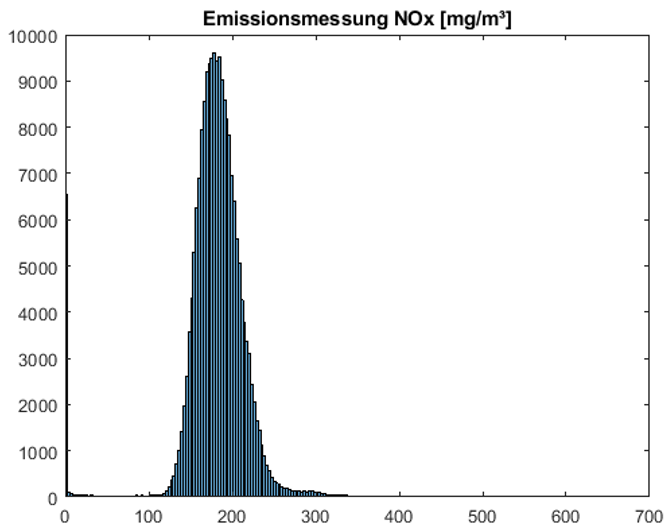
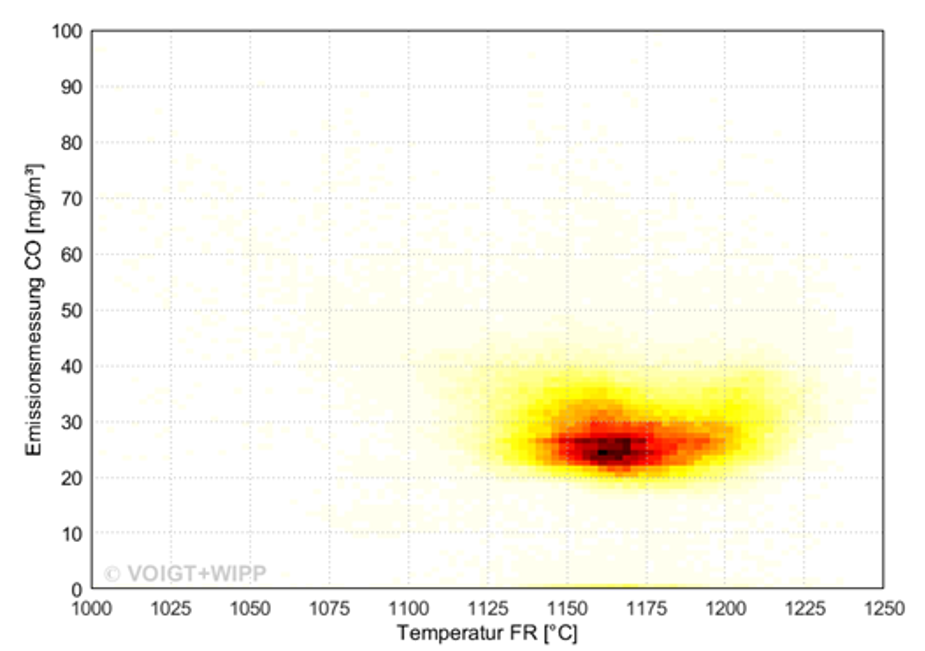
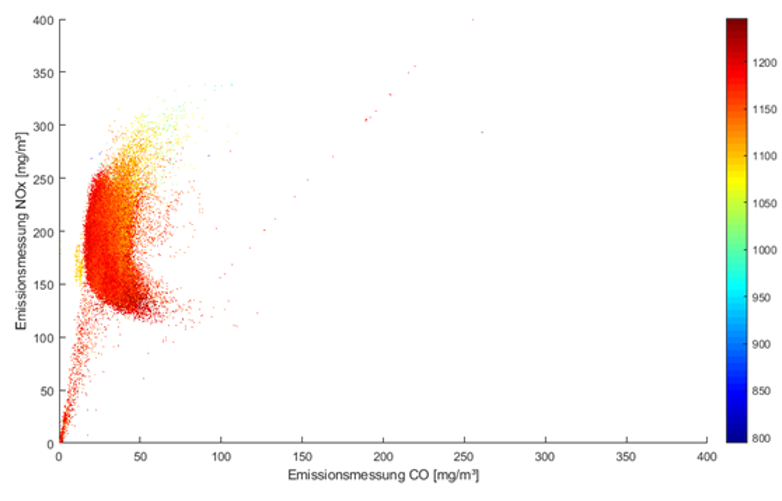
Examples for the visualisation of emissions
Related topics
- Analysis and concept for waste heat utilisation
- Concept of district and local heating networks
- Life Cycle Assessment
- CO2 reduction / avoidance concept
- Flue gas condensation
Products
Blog article on the topic

